Oil Technical Divergence - Watch Out For This
- Home
- Oil Technical Divergence - Watch Out For This
I wanted to point something out to help you prepare for a trade. This might happen or might not... but more often than not, it does happen.
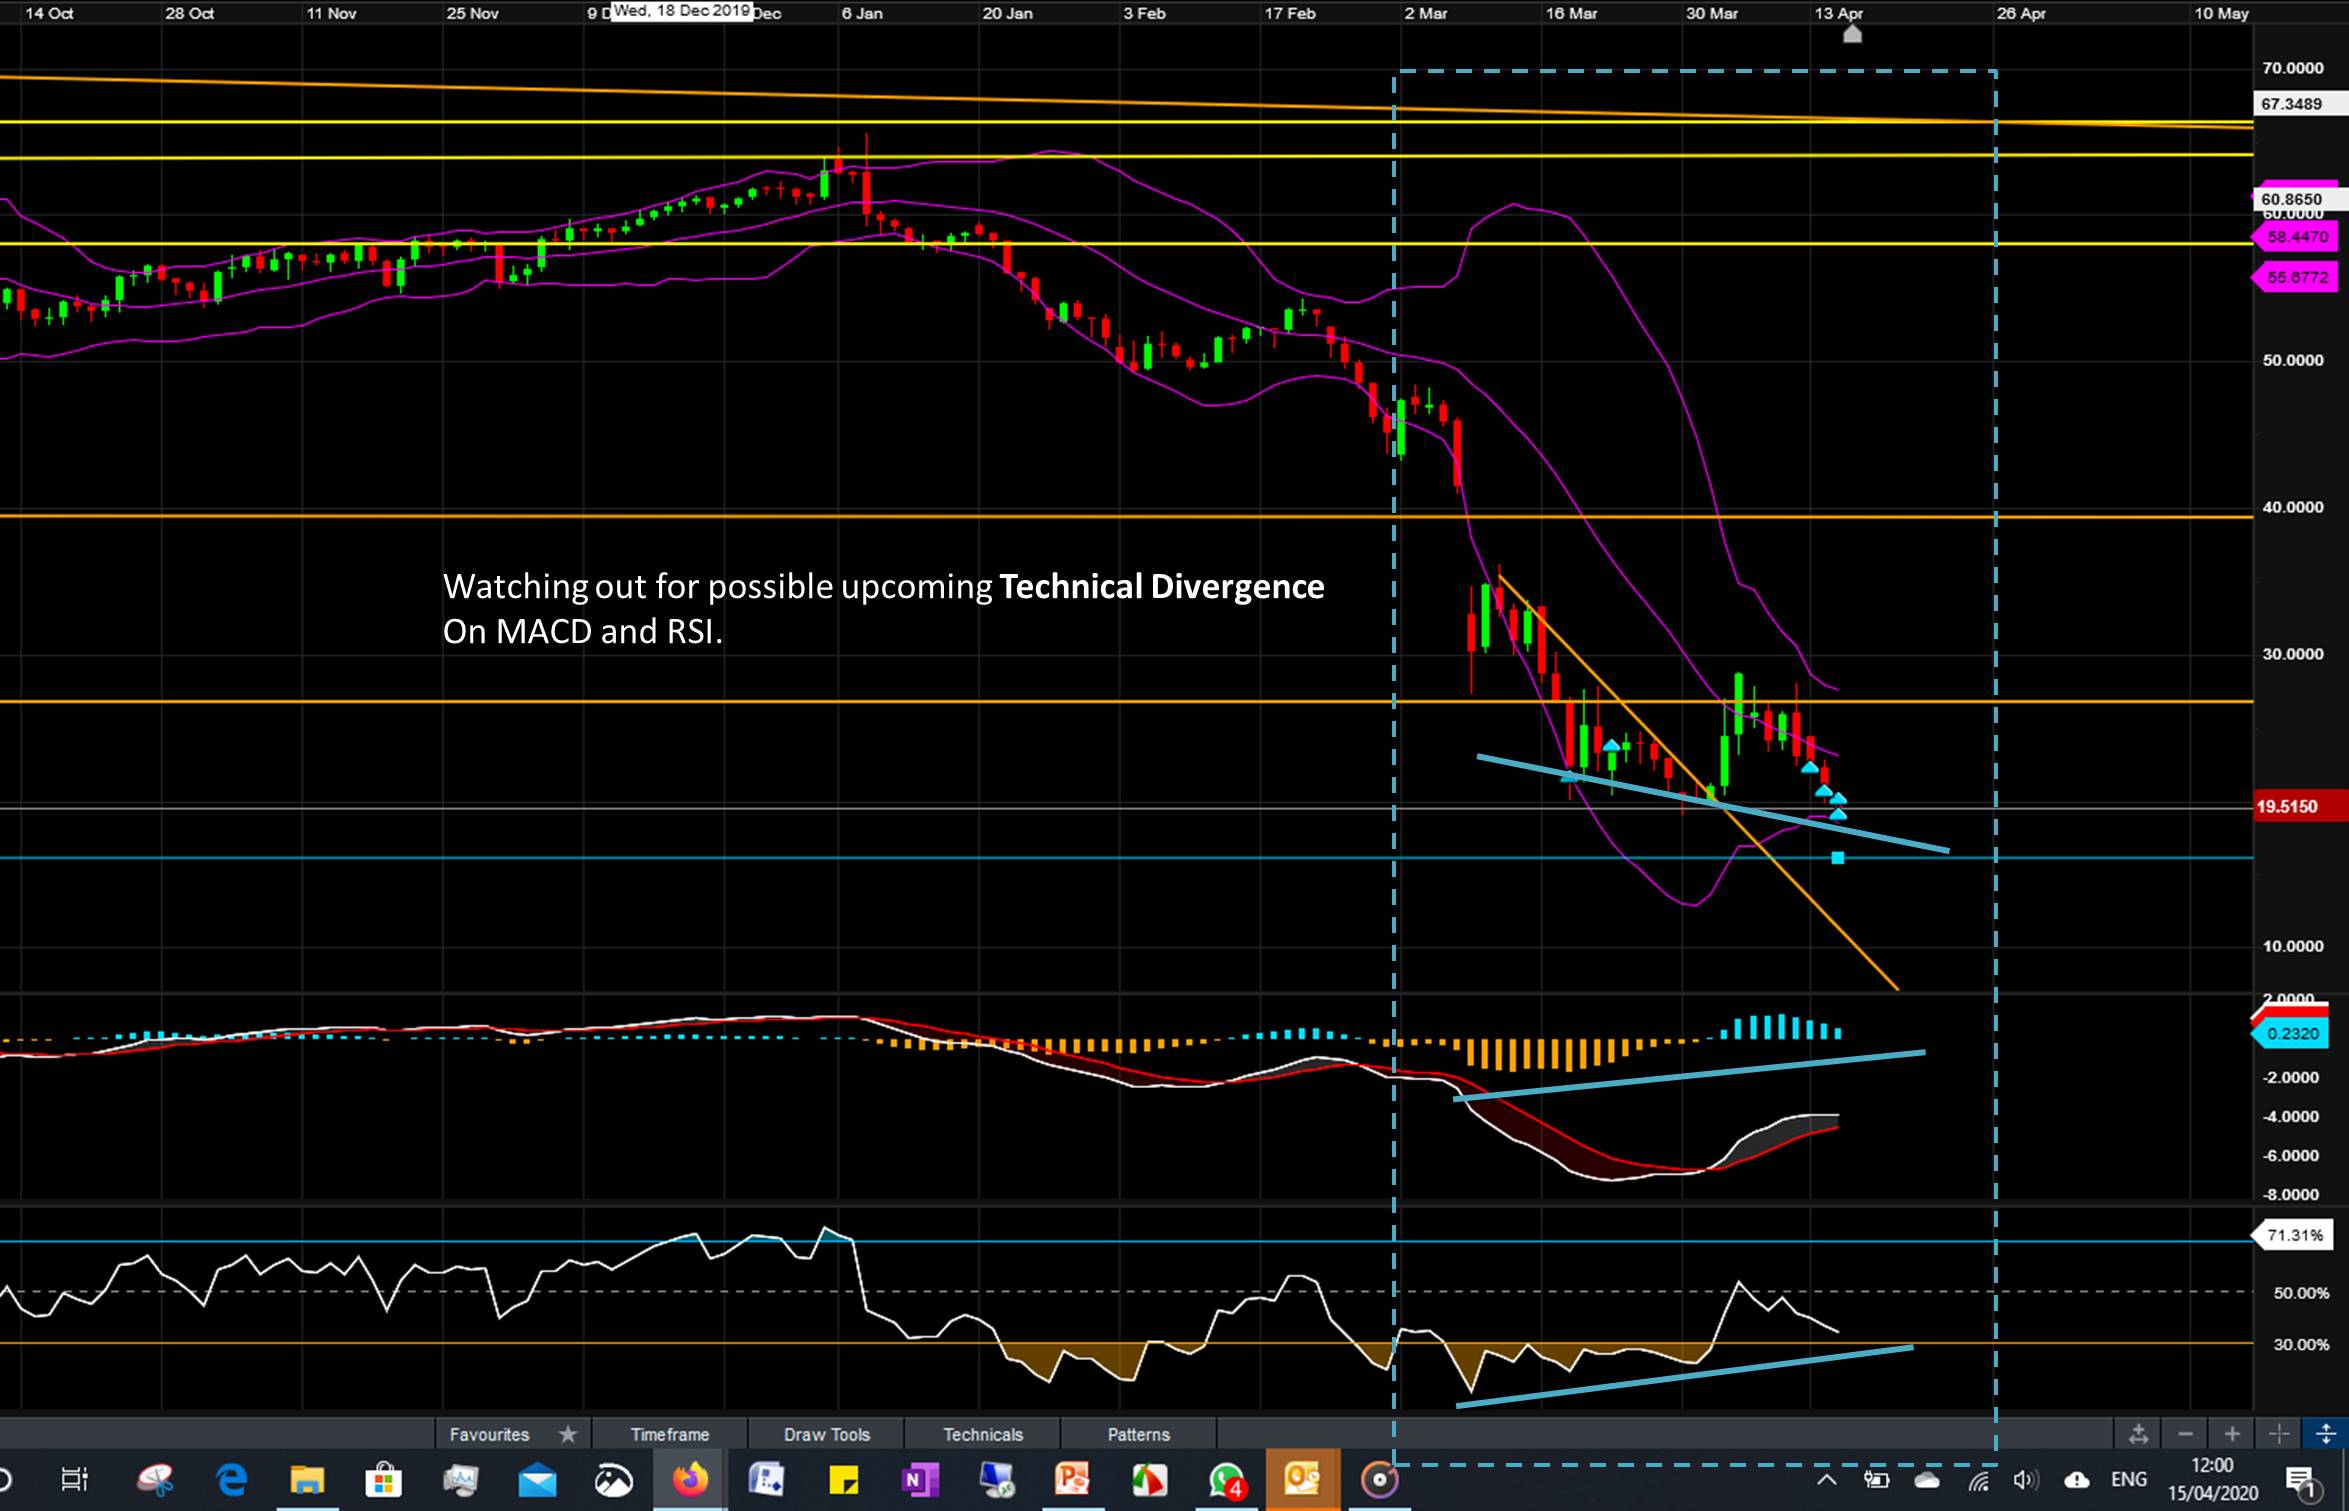
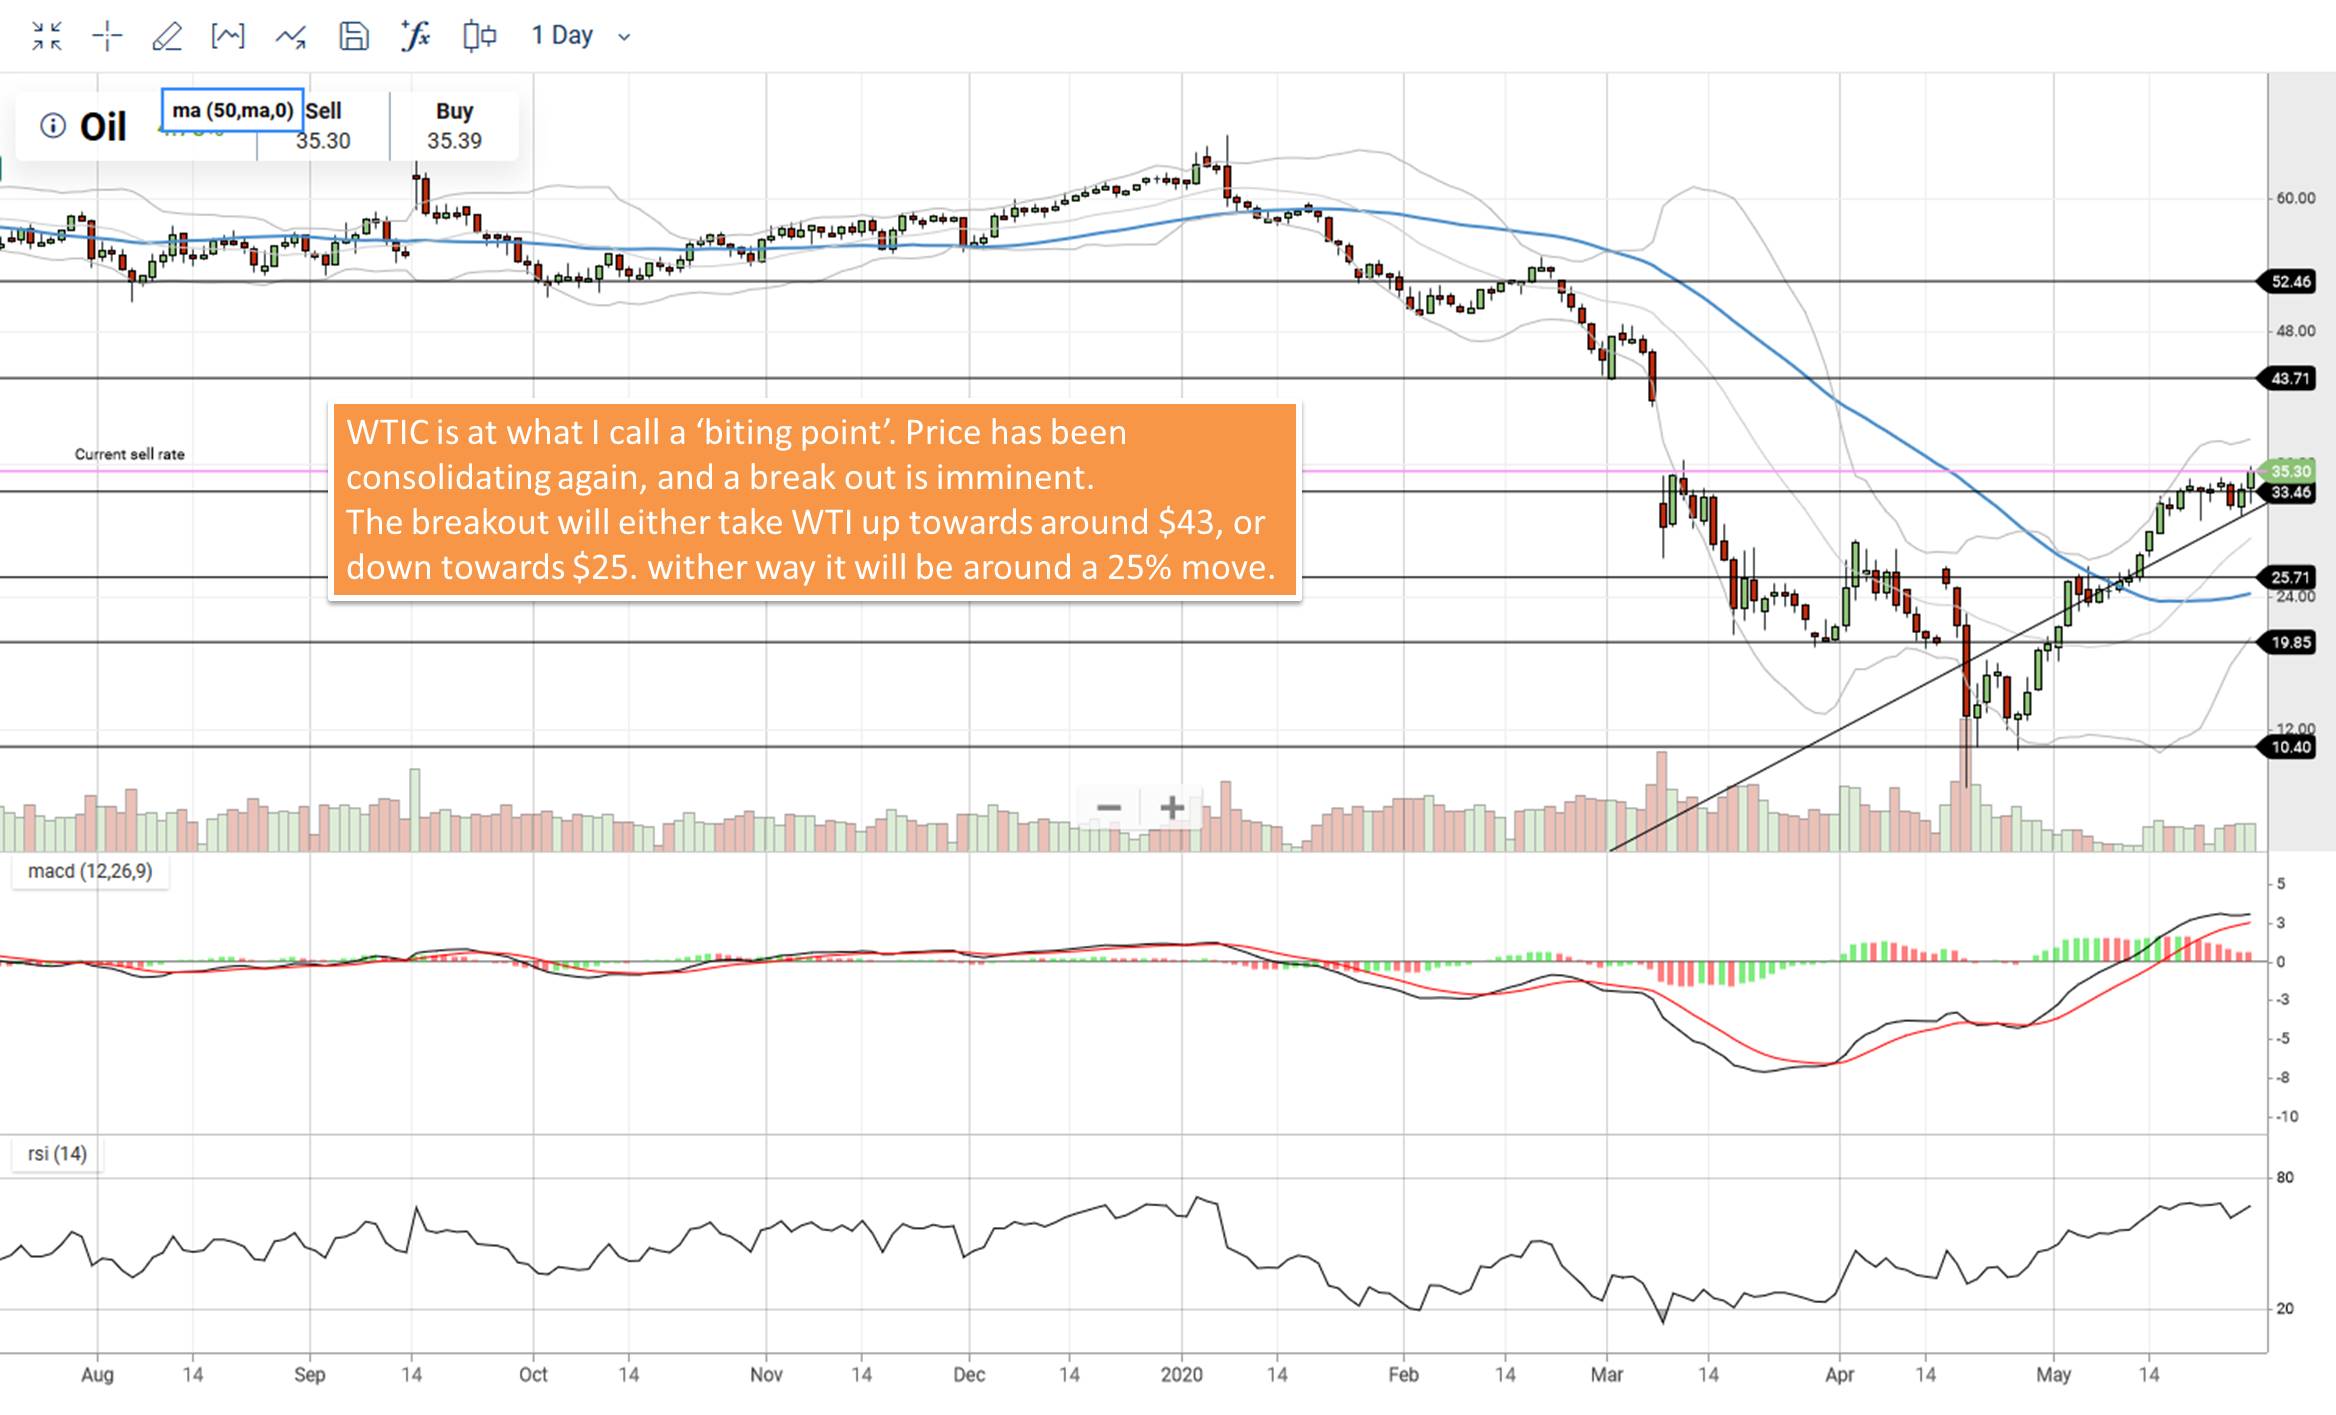
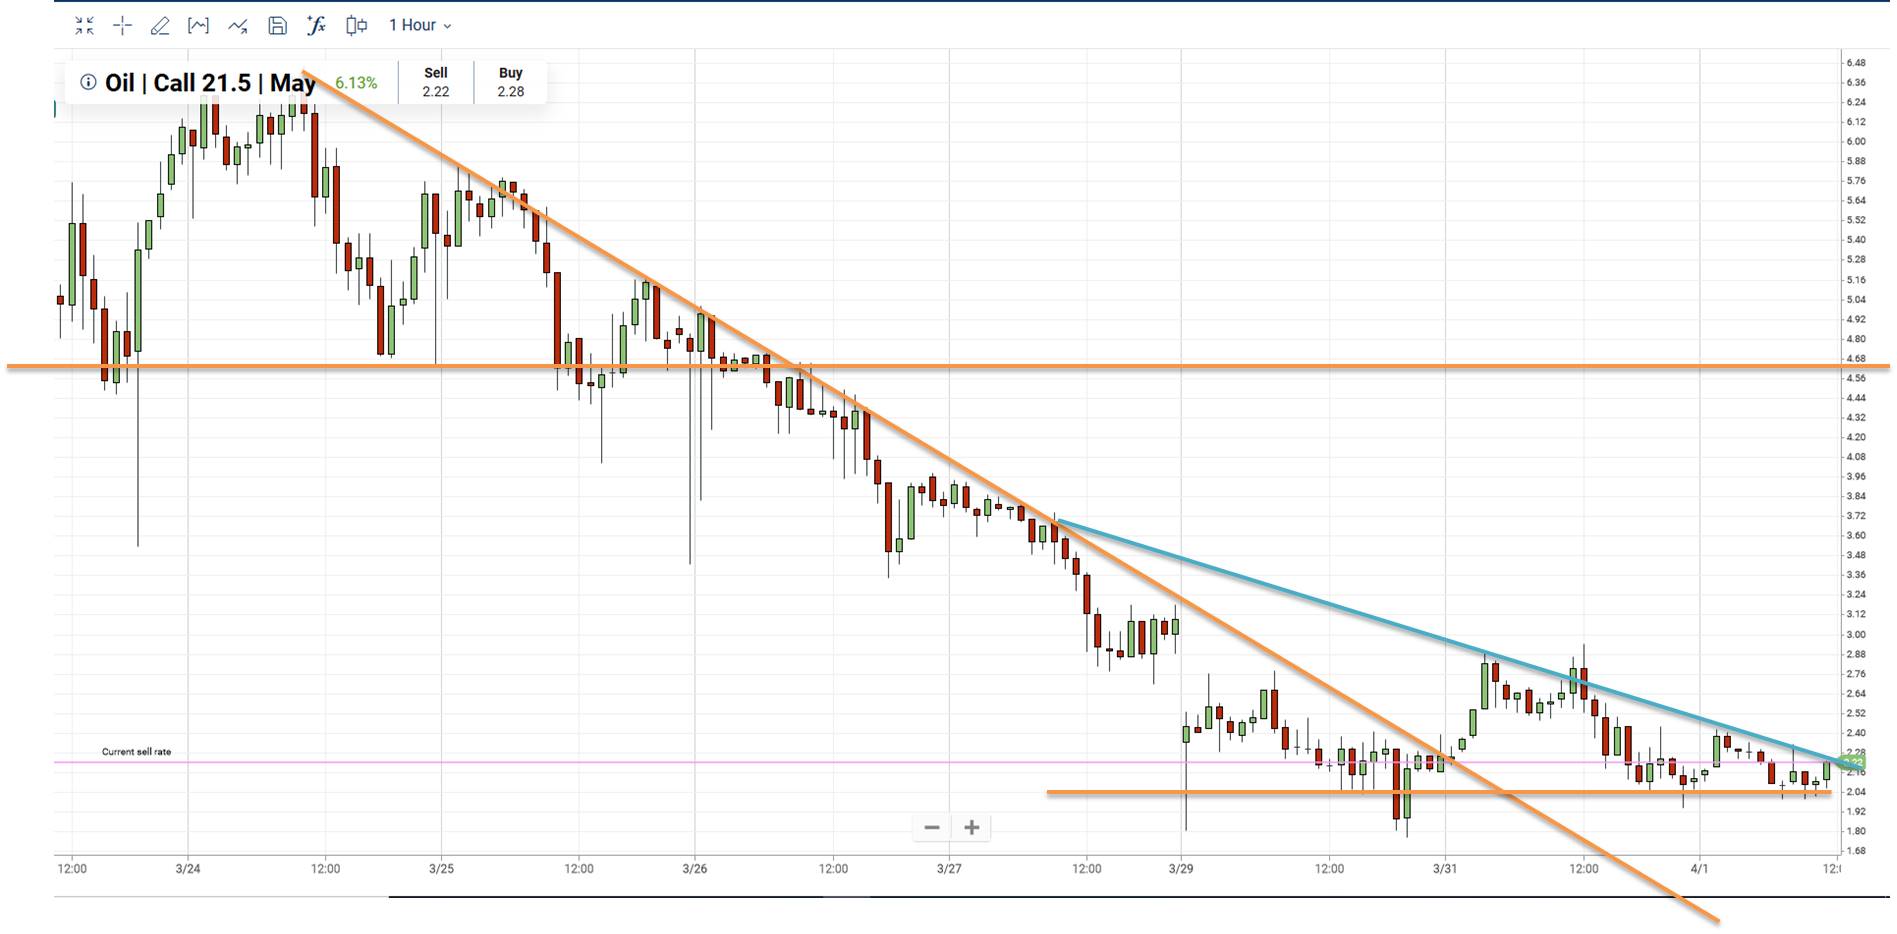
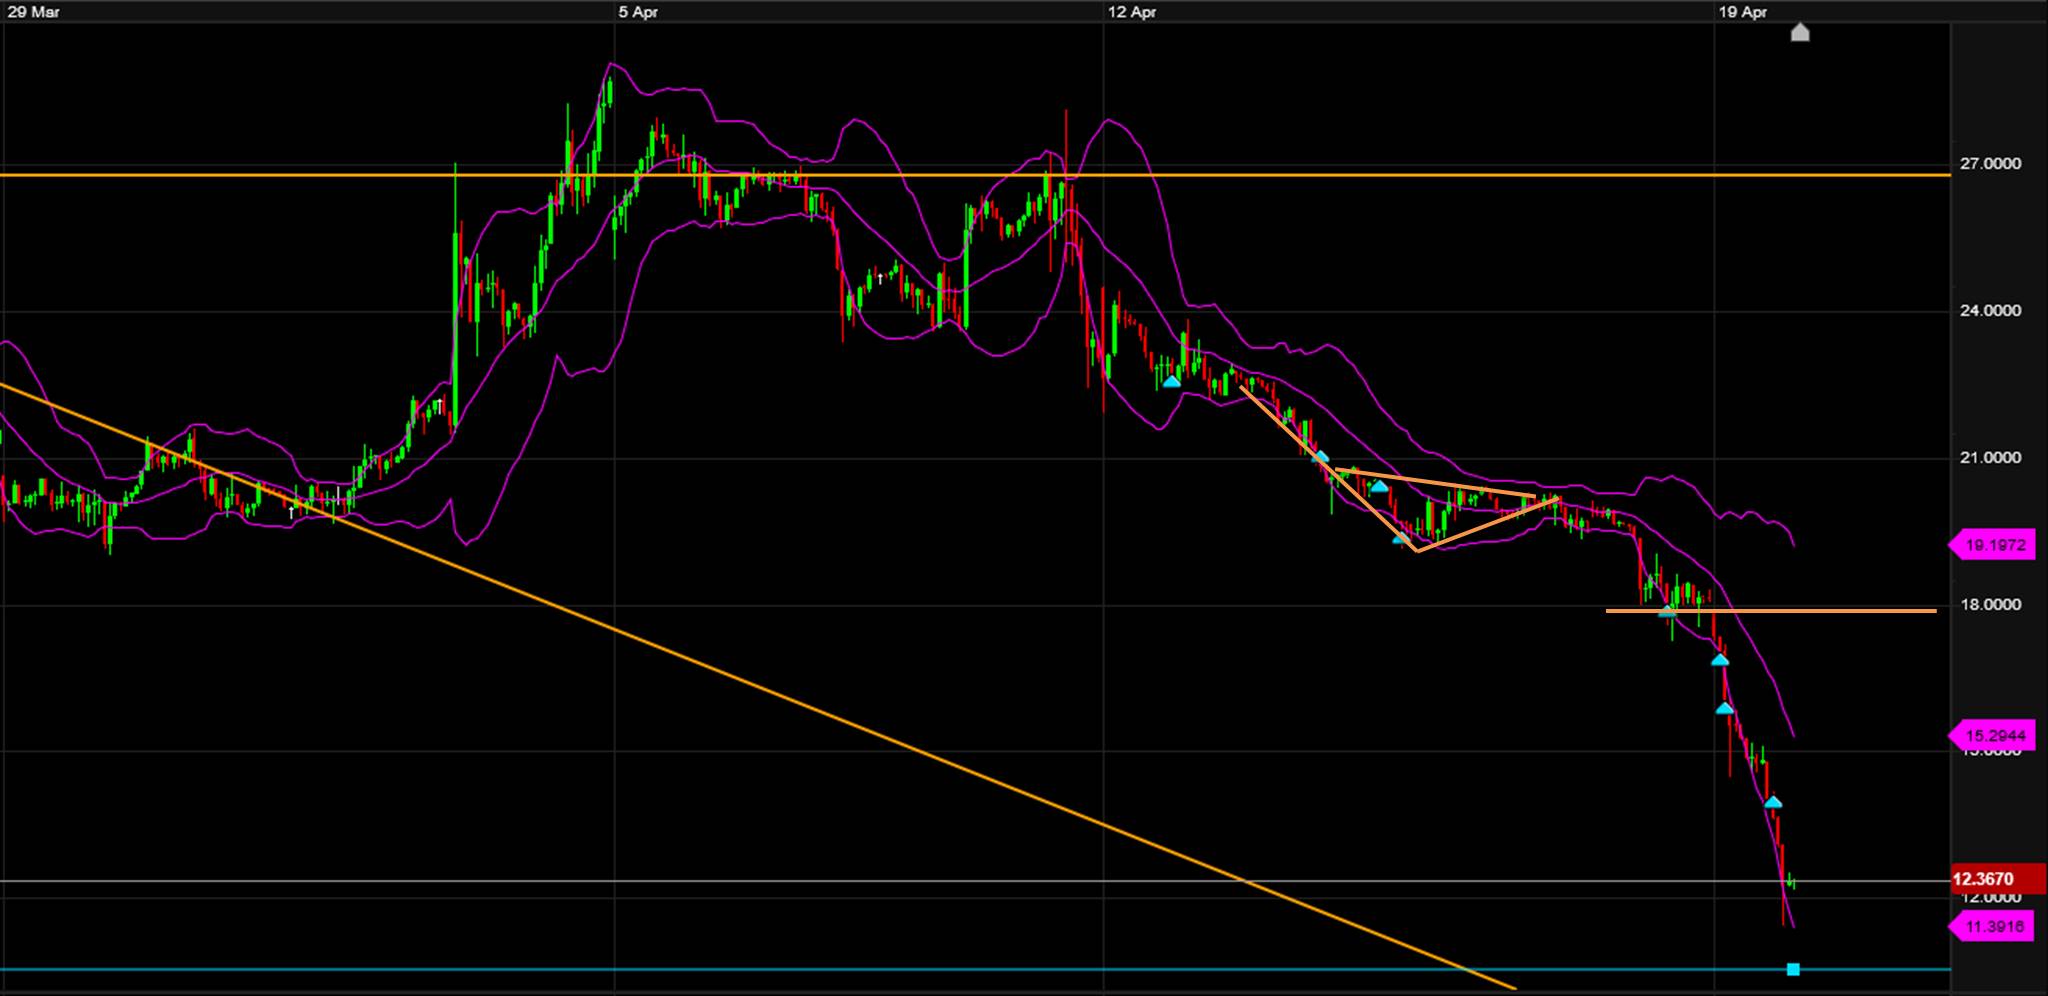
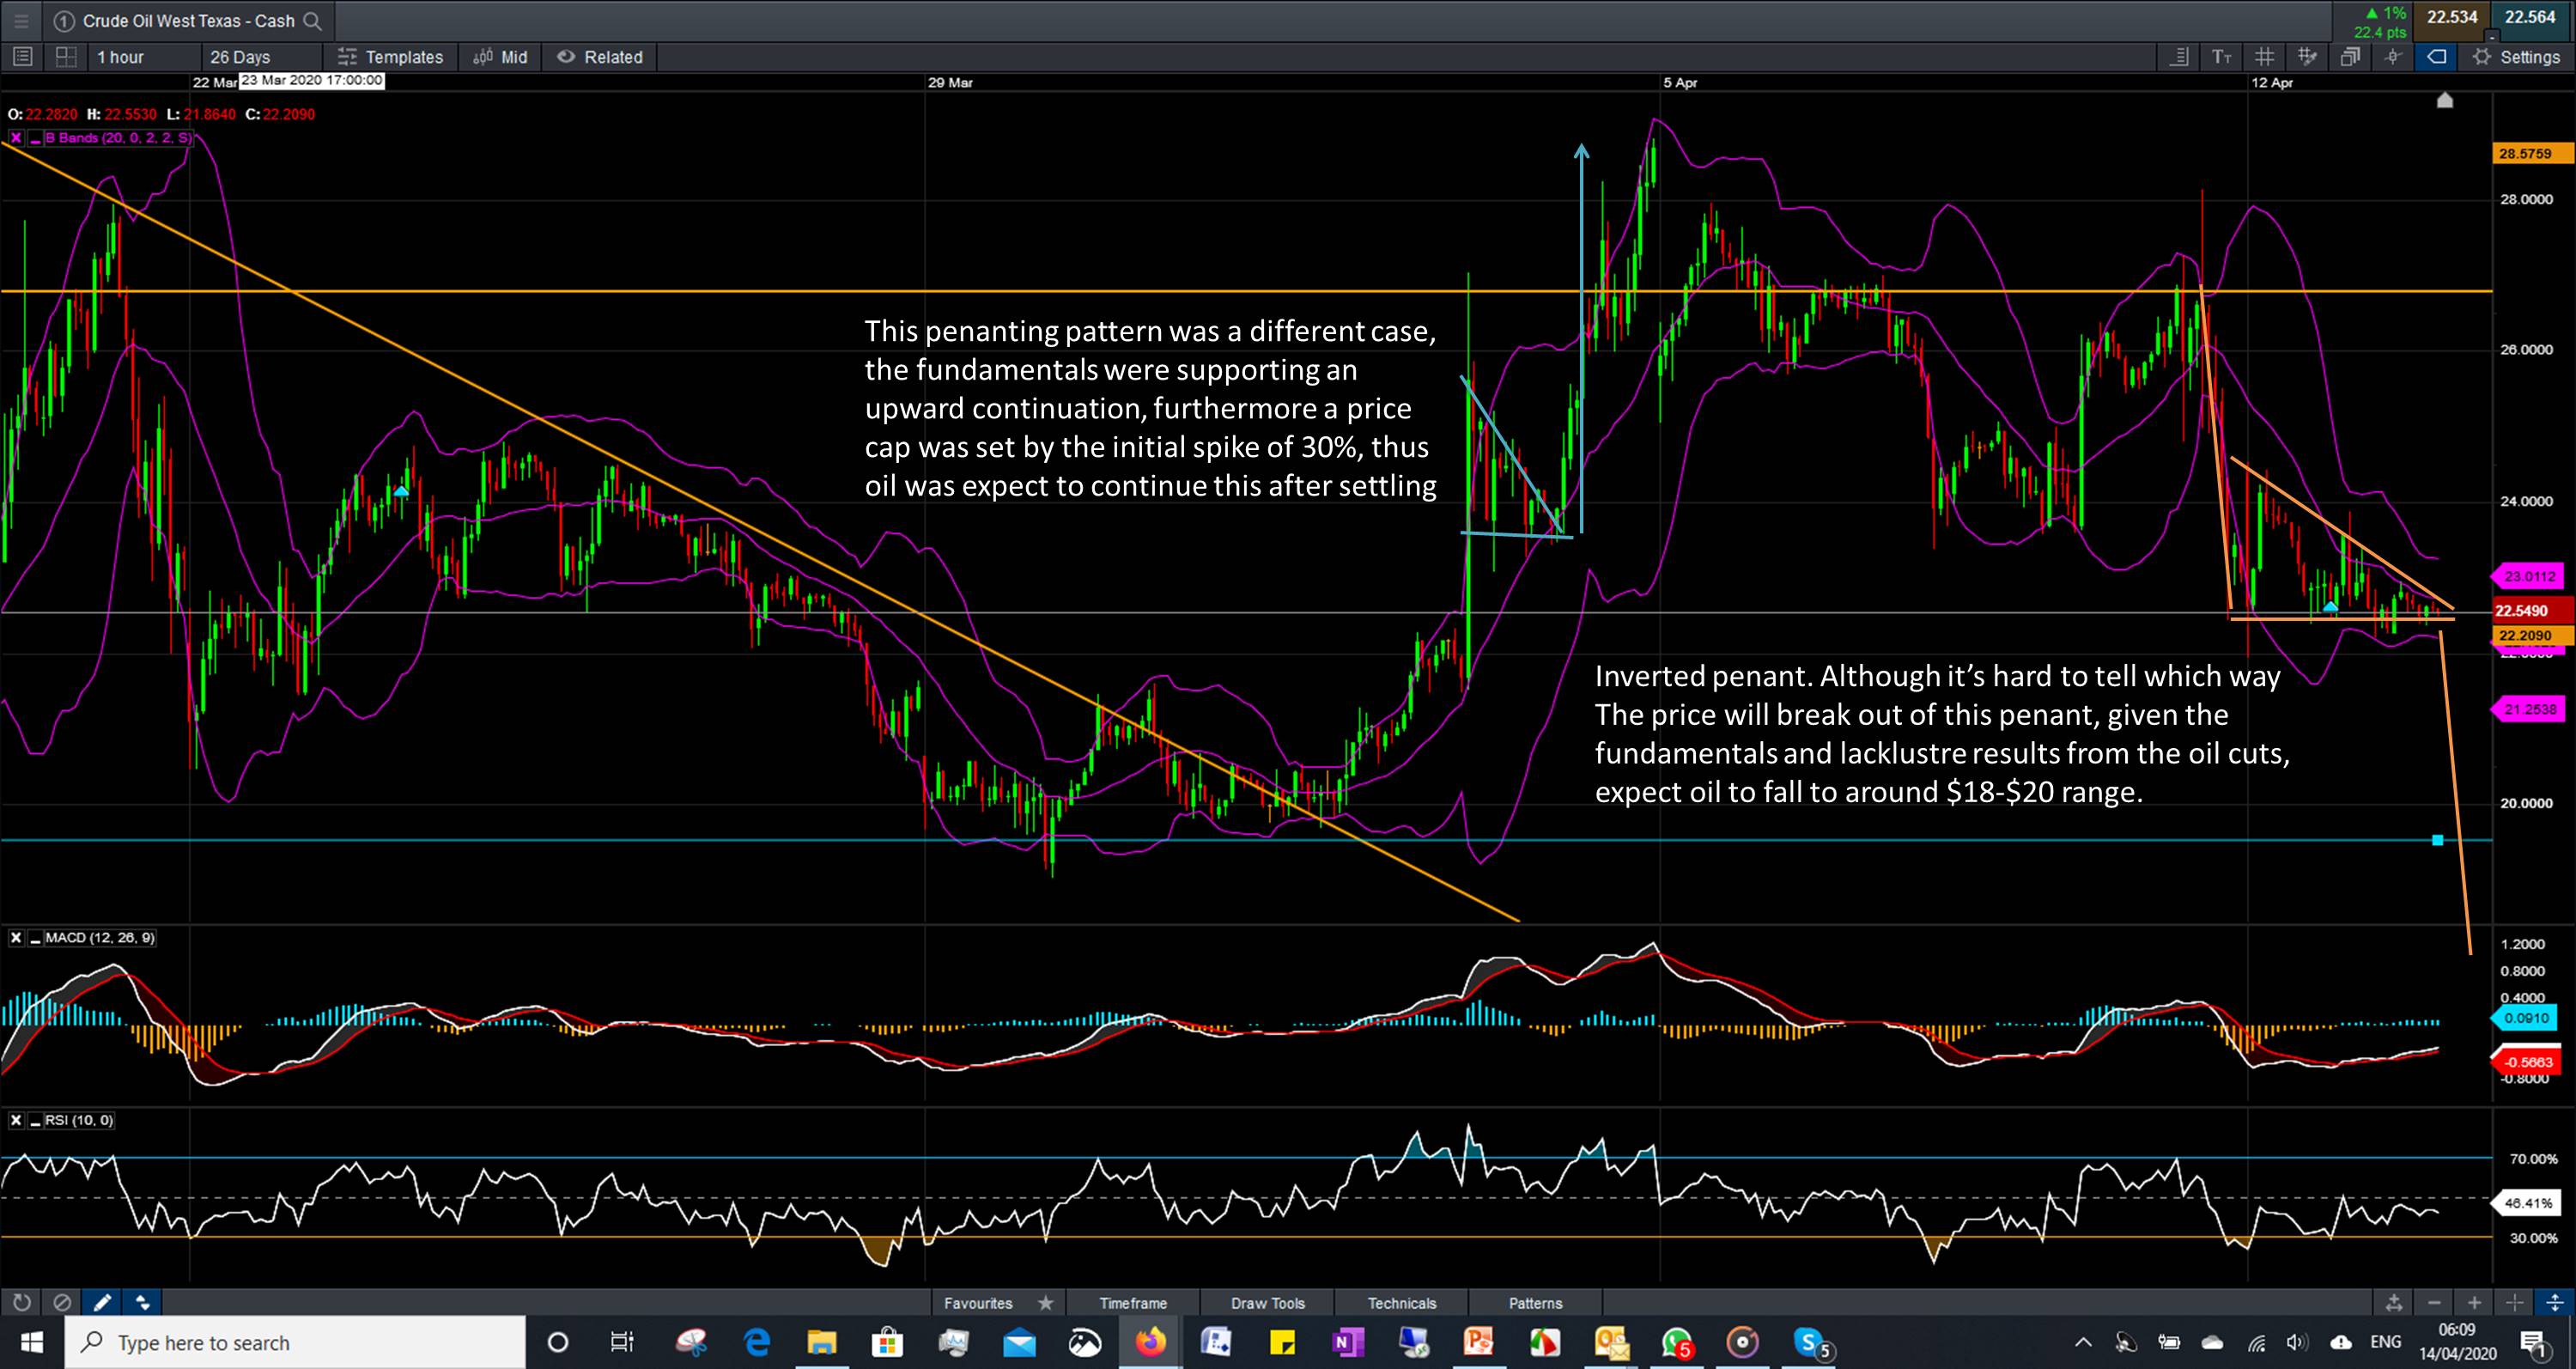
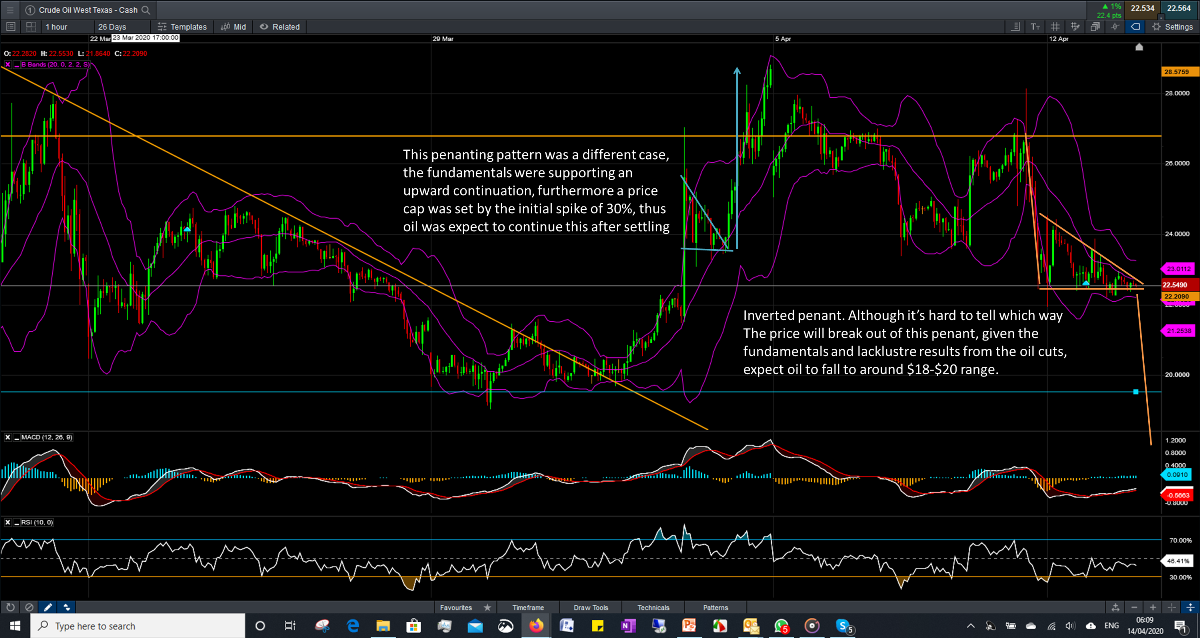
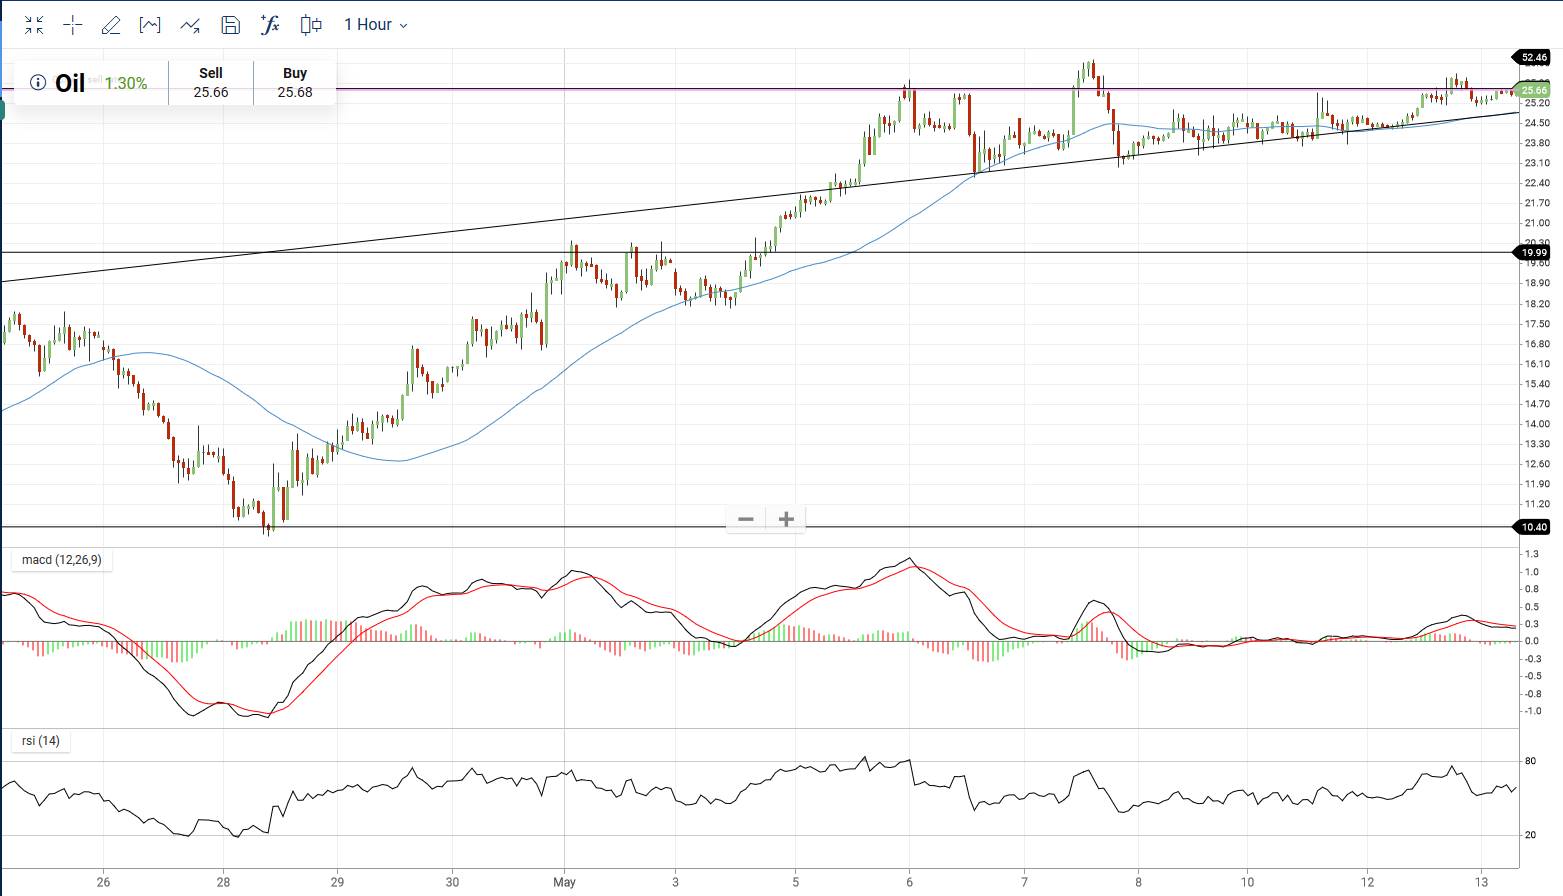
See the chart above.... observer the MACD and RSI.
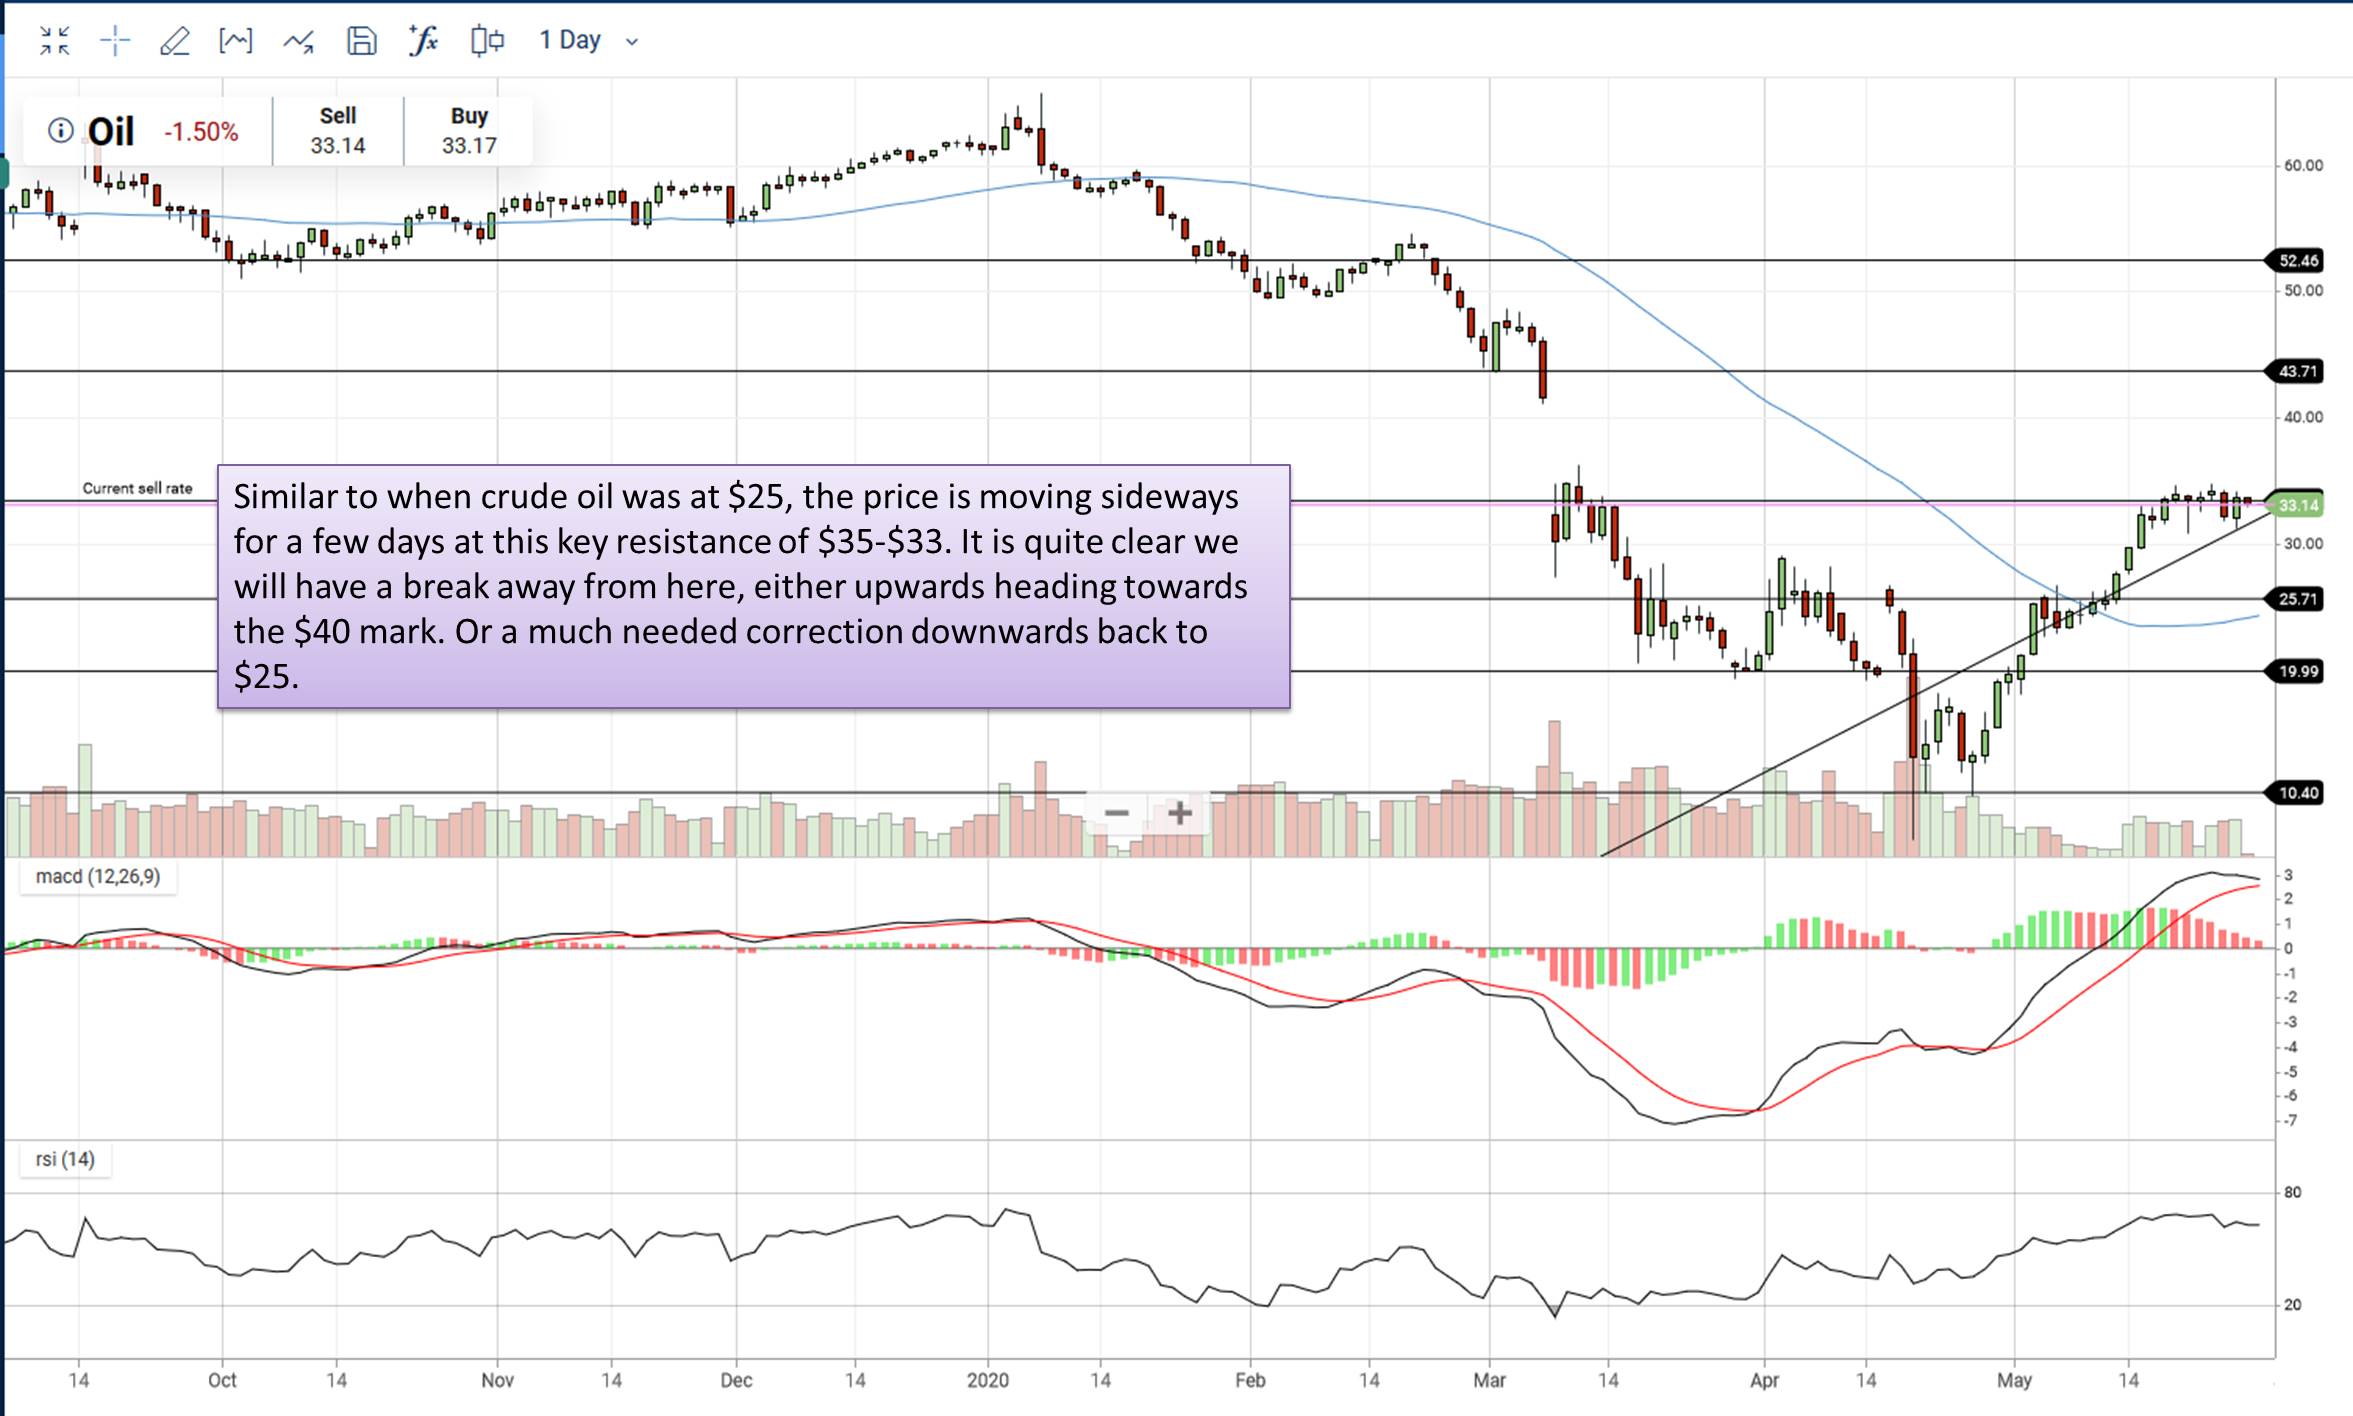
As Oil heads lower below $20, notice if the MACD histogram, and RSI levels remain at level higher than the previous bottom at $20.
What this essentially means is that at the lower price, there is more strenght in the market so to speak, and we call this a technical divergence which signals "weaker bears" and usually, the "bulls take over" and the price starts rising.
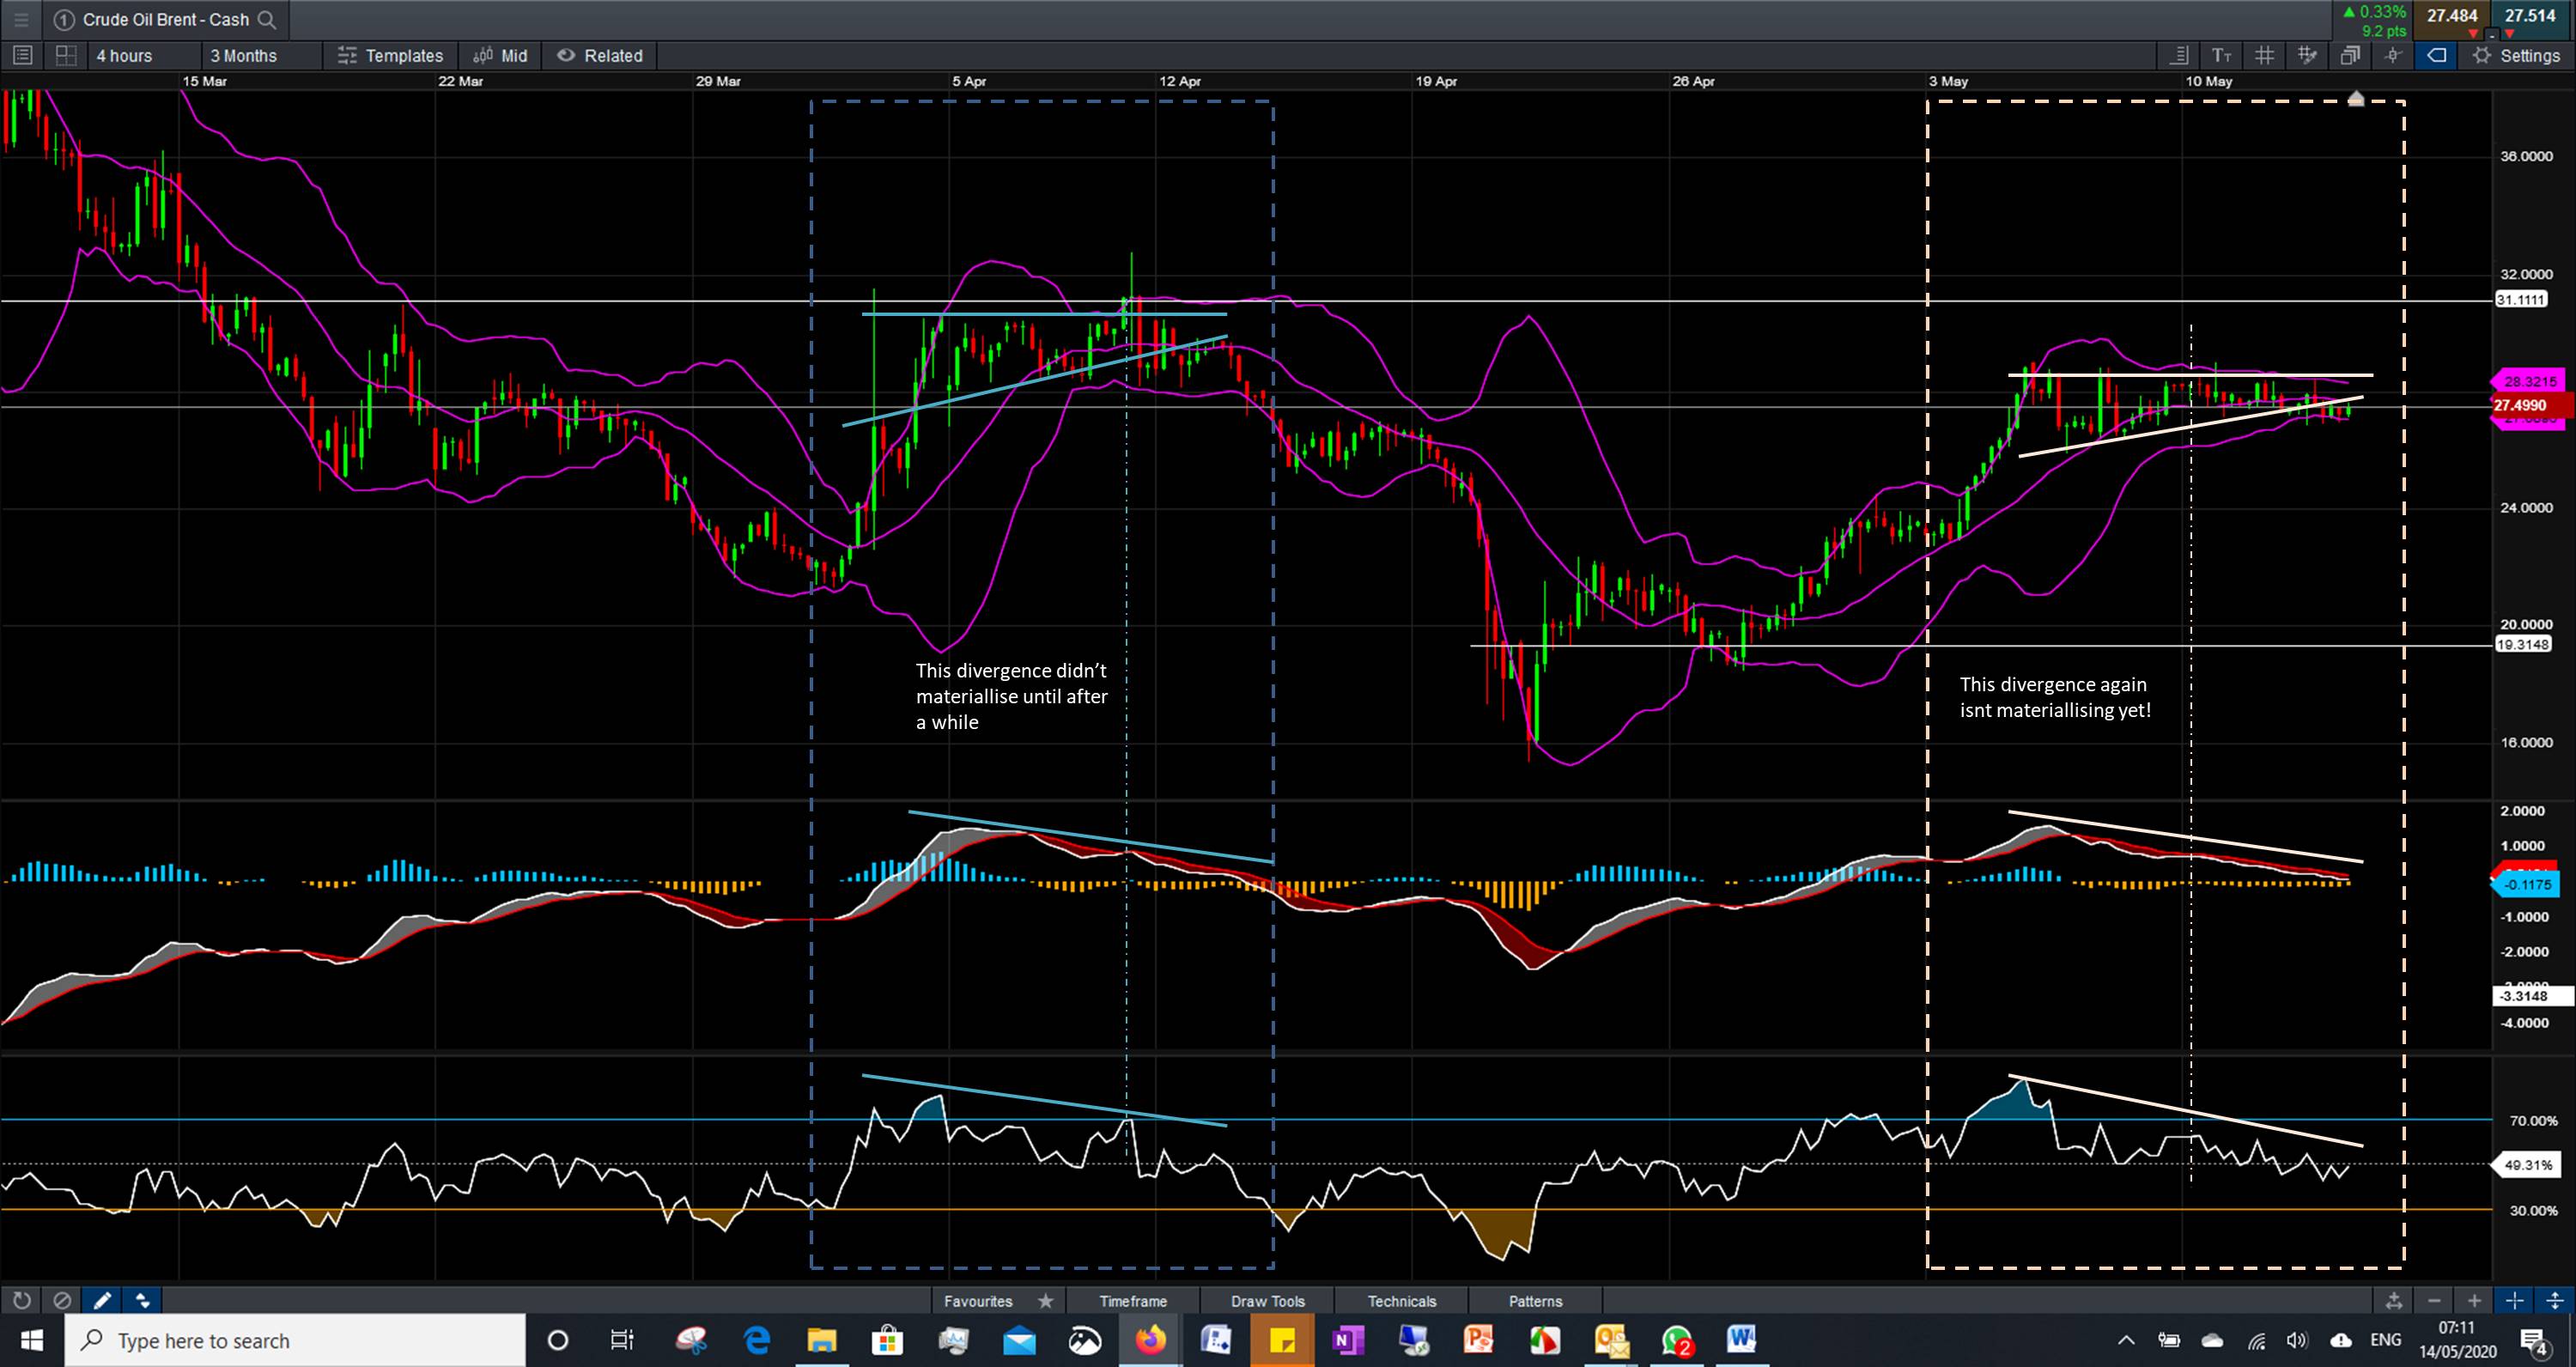
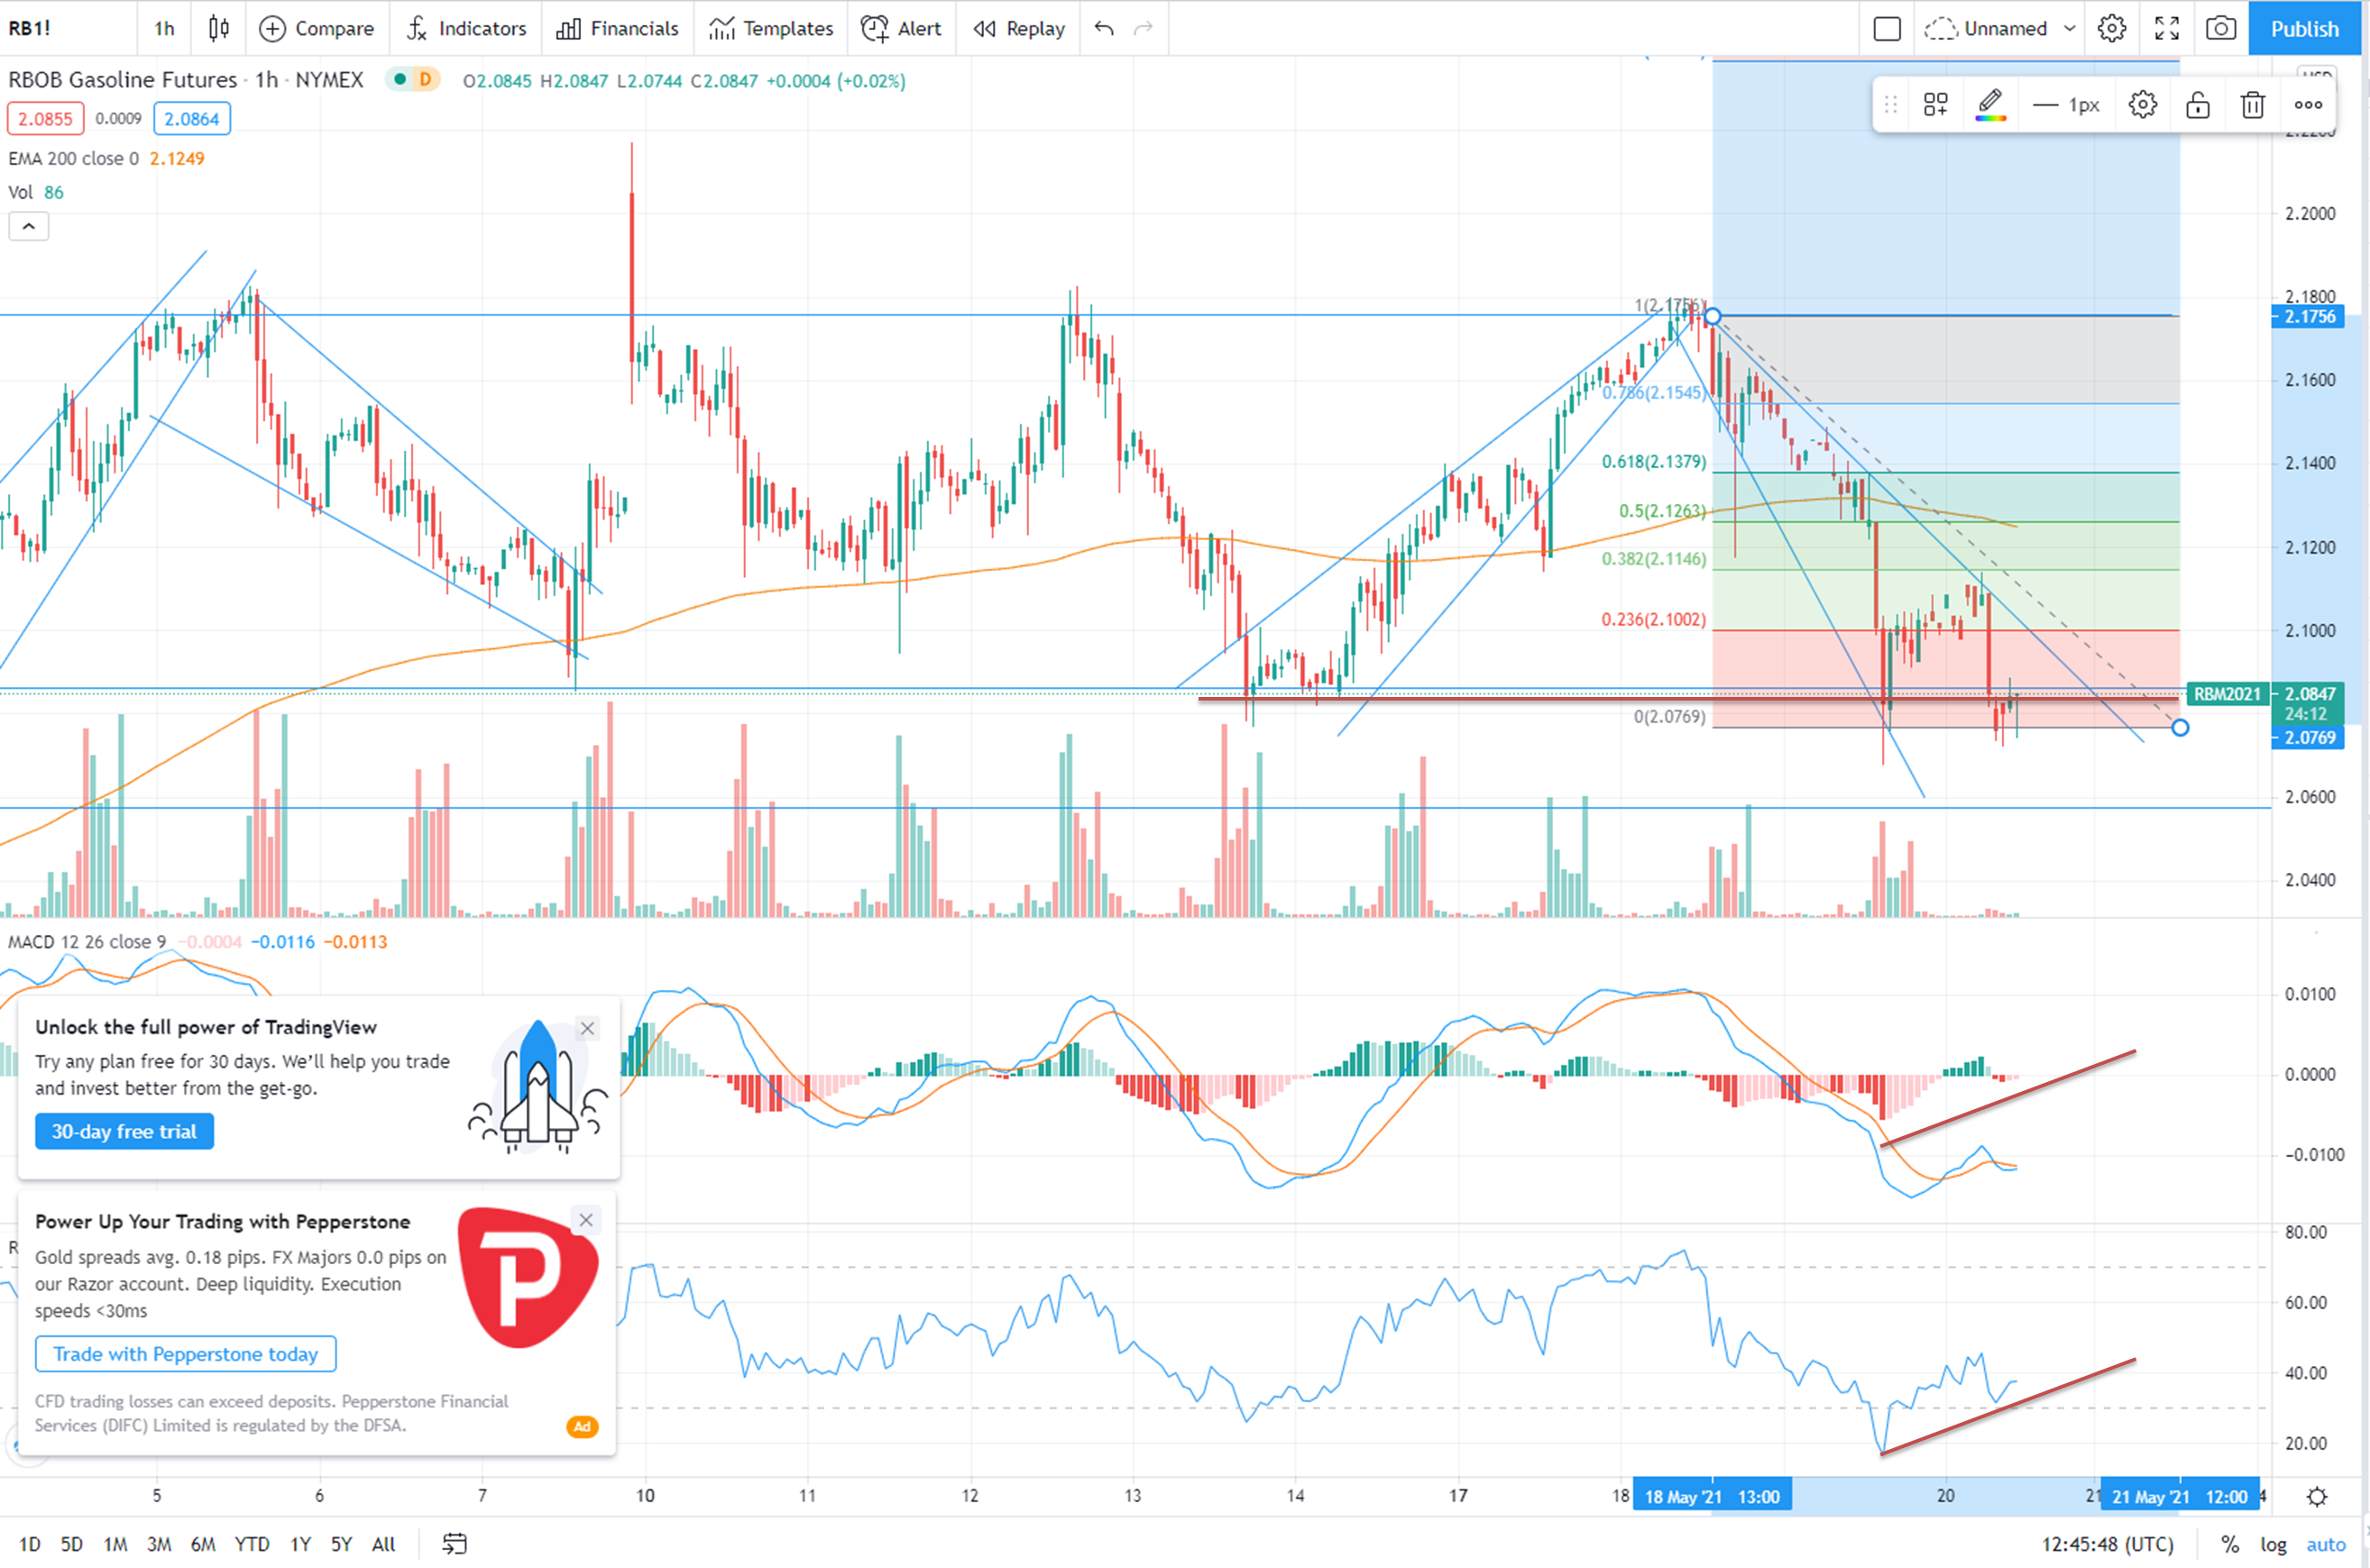
Here's an old example of divergence and you can see the price start moving up once the divergence is achieved. Check out the Learning Center for lessons on Divergence patterns.
- Admin
- 15 Apr 20
- 0 Comment
Related Posts
You have to logged in for comment.
Email Newsletter
Get subscriber only insights & news delivered by Financial Markets Club
Weekly Trading Lessons by Email
Do you want to Learn to Trade like a Pro? Every Week we will share some Trading Tips to help you Succeed.
Just enter your Name and Email, and click Subscribe!
 FinancialMarkets













Comments